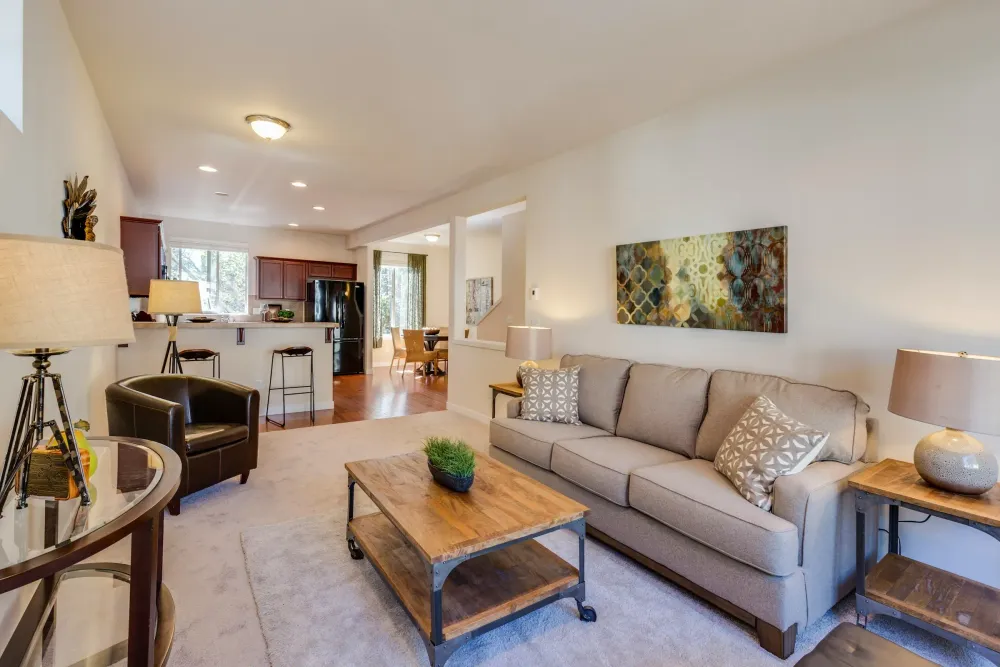
Key Location Criteria When Buying Real Estate
A property’s location affects not only daily comfort, but also its long-term value.
12.03.2026
Why Location Matters
A property’s location affects not only daily comfort, but also its long-term value. This simple but central statement is the starting point for every systematic location analysis and should form the basis of every real estate decision. In this section, we explain how concrete questions, measurement criteria, and recommendations for action can be derived from this starting point without subjective judgments, using only data-driven and comparable methods. From the basic idea that location influences both day-to-day usability and capital value, several thematic areas can be derived: accessibility and commute times, noise and traffic conditions, sunlight and shading, green space and surface sealing, as well as sociodemographic aspects of the neighborhood. Each of these areas can be measured systematically and brought together in standardized location reports. This turns an abstract statement into a practical evaluation framework that buyers, renters, and real estate professionals can all use. For accessibility, the focus is on measurable indicators: commute times in minutes, availability of public transit lines, distance to key service and employment locations, and isochrones, meaning map layers that visualize travel times and show which areas can be reached within a defined number of minutes. These metrics can be derived directly from the core statement, because short, efficient routes increase daily comfort and, over the long term, improve the attractiveness and therefore the value of a property. What matters here is separating subjective experience from objective measurement. A data-based location report should therefore provide clear indicators: typical commute-time windows, accessibility maps (isochrones), and the frequency and service density of transport options. These indicators make it possible to compare several locations using identical criteria. That is exactly the consequence of understanding that location shapes both comfort and value. Recommendation: use this statement as a checkpoint for every property evaluation. For every property you view, ask yourself: how does the location change my daily life? What effects does the location have on future value retention? Define measurable criteria and compare several properties using the same indicators. In this way, the central statement becomes concrete decision knowledge: location is not a feeling, but a measurable criterion with direct consequences for use and capital value.
- ✓ Recognize location as a core criterion
- ✓ Check commute times and isochrones
- ✓ Define data-based comparison metrics
Analyze Accessibility and Commute Times
The statement that location affects daily comfort and long-term value can be operationalized very concretely through accessibility metrics. Commute times are a central and immediately understandable indicator of everyday usability: short routes to work, school, or essential services reduce stress, save time, and therefore increase the attractiveness of a location. From a value perspective, this means that locations with consistently good accessibility appeal to a broader target group and tend to show more stable demand. In practice, it is advisable not to treat commute times as a single number, but as a distribution picture. That means identifying typical commute-time ranges for relevant destinations, work, shopping, school, leisure, and visualizing them as isochrones. Isochrones are maps that structure areas by accessibility times and show which places can be reached within, for example, 10, 20, or 30 minutes. This visualization makes the effect of location on daily life immediately visible and enables a standardized comparison between properties. Key metrics and approach in practice: 1. Commute time in minutes: measure the average real travel time to relevant destinations using the usual means of transport. Use several time windows, rush hour and quiet periods, and document variation. 2. Public transit density and frequency: the number and quality of connections, for example service intervals, influence reliability of accessibility. High frequency increases flexibility and reduces waiting times. 3. Multimodal accessibility: combine walking, cycling, public transit, and car travel to reflect real everyday routes. Different households have different mobility patterns, so a complete picture should account for all common modes. 4. Isochrone maps: create simple maps showing travel times to central destinations. Visualizing accessibility provides an intuitive basis for decisions and makes comparisons easier. Recommendations for buyers and renters: - Define priority destinations: work, school, medical care, shopping. Measure commute time to these destinations. - Compare several properties using identical isochrones and commute-time metrics. - Consider reliability: not only the average time matters, but also the variance, for example congestion or service disruptions. Conclusion: accessibility is a direct link between daily comfort and the lasting value of a property. Anyone who measures it systematically makes decisions that follow the core statement introduced above: location affects daily life and value, measurably, comparably, decisively.
- ✓ Measure commute times for core destinations
- ✓ Create isochrones for comparison
- ✓ Document service frequency and transport modes
Environmental Factors: Noise, Sun, Green Space
The core statement that location influences comfort and value includes environmental factors such as noise, sunlight, and available green space to a very large extent. These factors affect living quality directly and the long-term attractiveness of a location indirectly. That is why their systematic inclusion in data-based location reports is essential. Noise: noise affects comfort and health and is therefore a relevant value factor. For objective evaluation, it is advisable to use measurable units such as sound levels in decibels and their time distribution, for example day and night profiles. In a data-oriented location report, noise sources should be identified and their spatial extent analyzed. It is also relevant to assess local noise-reduction measures, since these influence long-term quality of life and therefore value retention. Sunlight hours and shading: sunlight affects living comfort, heating and cooling demand, and the attractiveness of outdoor areas. Location determines how many hours of sun a property receives on average and to what extent shading occurs due to neighboring buildings or topography. Measurement criteria can include hours per day or per season, as well as qualitative statements about shading windows. For buyers, this information is important in order to assess daylight quality, photovoltaic potential, or passive solar gain. Green space and surface sealing: accessible green areas improve recreational quality, regulate temperature, and support biodiversity. On the other side is surface sealing, which can affect the local climate. A location report should show the ratio of green space to sealed surface in the immediate surroundings and provide information about access to local recreation areas. This creates transparency for residents who value recreation, play areas for children, or a more nature-oriented setting. Practical measurement and evaluation approach: - Sound level analysis: documentation of existing measurements or model calculations, including day and night profiles. - Sunlight analysis: visualization of sunlight exposure and shading over daily and seasonal cycles. - Green space ratio: ratio of green area to built-up area in the surroundings, plus accessibility of parks and open spaces. - Surface sealing level: indicator of local environmental stress and heat infrastructure. Recommendations for decision-making: 1. Insist on objective measurements or standardized assessments of these factors in the location report. 2. Prioritize the factors according to your personal needs, for example quiet versus central location, or plenty of sun versus a more shaded setting. 3. Compare several properties using the same environmental indicators to avoid subjective distortion. In summary, environmental factors connect daily living comfort with long-term location quality. Measuring them is a clear way to translate the opening insight into concrete options for action: location affects comfort and value, and that can also be measured through noise, sunlight hours, and green space.
- ✓ Check sound levels and day-night profile
- ✓ Analyze sunlight hours and shading
- ✓ Document green-space availability
Sociodemographics and Data-Based Location Reports
The idea that location influences comfort and value also includes sociodemographic characteristics and their structured evaluation in data-based location reports. Sociodemographic data, such as age structure, household sizes, and neighborhood composition, shape infrastructure needs, service offerings, and long-term demand. A well-founded location report combines these demographic insights with spatial indicators to provide a comprehensive picture of location quality. Data-based location reports bundle indicators from accessibility, environmental factors, and sociodemographic metrics. Their added value lies in comparability: several locations are assessed using identical criteria so that decisions can be made on the basis of verifiable data. This approach corresponds directly to the implication of the opening statement: if location affects comfort and value, then location has to be measured systematically and made comparable. Elements of a meaningful location report: - Standardized metrics: commute times, sound levels, sunlight hours, green-space ratio, surface sealing, accessibility of essential services. - Sociodemographic profiles: age structure, household structure, and demand indicators that show target-group affinity for a location. - Comparison metrics: indices or scoring models that make different locations comparable along the same scale. - Visualizations: isochrones, noise maps, sun schemes, and green-space maps support readability of the data. Recommendations for buyers, renters, and professionals: 1. Set clear priorities for relevant indicators according to your life situation, for example families with children versus working adults without children. 2. Use location reports to make several properties comparable: request the same indicators for every property under review. 3. Pay attention to the reliability of data sources and transparency of methodology. Only then are the findings interpretable and comparable. In conclusion, sociodemographics and data-based location reports operationalize the central thesis of this text. They make the impact of location on daily life and capital value transparent and enable decisions that go beyond subjective impressions. Anyone who takes this seriously acts in line with a fact-based, future-oriented real estate decision.
- ✓ Request standardized indicators
- ✓ Check sociodemographic relevance
- ✓ Review methodology and data sources
Practical Checklist for Decisions
The core statement, “A property’s location affects not only daily comfort, but also long-term value,” can be turned into a practical checklist that supports buyers, renters, and real estate professionals in evaluation. The following list is intended as a practical translation of this principle and summarizes key review areas and concrete steps. Review areas and concrete steps: 1) Accessibility and commute times: define your most important destinations, work, school, shopping, and measure commute times across several time windows. Create isochrones to see which areas can be reached within relevant minute ranges. 2) Infrastructure and services: assess walkable and bikeable access to daily amenities, educational institutions, and healthcare facilities. Document the frequency and reliability of public transport. 3) Noise and environment: request noise profiles and review sunlight exposure and shading factors. Identify existing green areas and document the level of surface sealing in the surroundings. 4) Sociodemographics and neighborhood: analyze the age and household structure of the district and consider whether that structure fits your needs. 5) Long-term perspective: ask about urban planning measures that could change the location and assess how robust the location quality is against possible changes. 6) Comparison and documentation: create the same question and measurement catalog for every property under consideration. Only then are direct comparisons possible. 7) Data quality: pay attention to where the data comes from and how transparent the methodology is. Data-based location reports should state understandable sources and procedures. Conclusion and application: this checklist translates the opening statement into concrete action points. It enables a structured, data-oriented assessment of property locations that takes both daily comfort and long-term value retention into account. Anyone who follows these steps systematically increases the quality of their decision and reduces subjective misperceptions.
- ✓ Check isochrones and commute times
- ✓ Request noise profiles and sunlight data
- ✓ Use a consistent comparison framework


