Understanding Building Heights and Development: How to Read the Height Map in the Relocheck Location Report
Building heights in the surrounding area affect views, privacy, daylight, perceived openness, and often how a property can be marketed. This article explains the “personal height map” in the Relocheck Location Report (average heights by radius plus percentage comparison) and shows how buyers, renters, families, investors, and property professionals can compare built form objectively.
12.03.2026
Why Building Heights and Urban Form Are Not a Minor Detail in Real Estate
Many purchase and rental decisions are made based on floor plan, finishes, and price, and only later does it become clear that the immediate built environment shapes everyday life at least just as strongly. Building heights and development density are a location factor because they do not come from the property itself, but from its surroundings: how tall and how close neighboring buildings are determines sight lines, privacy, the feeling of openness or tightness, and whether outdoor spaces such as balconies or terraces are perceived as a retreat or as an exposed stage. Another point is long-term comparability: two apartments can be in the same district, on the same street, and even have the same price, but one may sit in a low-rise, open setting while the other is surrounded by substantially taller buildings. That affects not only how the home feels, but also typical use patterns: where do you place the desk, how pleasant is it to work with the windows open, how exposed do you feel to facing buildings, which view remains, and which one is structurally limited by surrounding construction? For families, taller surrounding buildings can mean that courtyards are used more as living space if they feel protected, or that those same courtyards feel too tight and overlooked. For renters, the key question is often whether the location feels calm, open, and private in daily life and how well that fits with working from home. Buyers and investors also think about long-term value: location effects such as restricted views or high visibility from neighboring buildings are difficult to fix later and often influence marketing indirectly. That is exactly why it helps to treat building height not only as a subjective impression, “it feels tall,” but as a standardized benchmark. The Relocheck Location Report does this with a visualization that compares the average building height around the property across several distance bands with the surrounding area, making urban form objectively readable.


What Your Personal Height Map in the Report Actually Shows
The height analysis in the Relocheck Location Report is built around two core elements that together explain the built reality of a place. First: a comparison of the average building height within several radii around the location. The report uses concentric circles for this, for example 75 m, 150 m, 250 m, 375 m, and 500 m. For each of these circles, an average building height in meters is reported. Second: a percentage-based classification of those values relative to the surrounding area. This is the key interpretation lever: a bar above 100% means that, on average, the buildings in the radius being examined are taller than those in the surrounding area. A bar below 100% means they are lower. This means the chart shows not only height, but deviation from the context. That is especially useful in practice because it separates two typical questions: how tall is the development directly around me, the close range that shapes privacy, sight lines, and the feeling of tightness, and is my location comparatively dense and tall or comparatively low and open in the broader neighborhood context, the context that explains how unusual the situation is and how much it differs from alternatives. The report also states a clear impact logic. Surrounding building heights can limit views and attractiveness when a property is enclosed by taller buildings; conversely, a property that stands higher than its surroundings may be perceived as more desirable or more prestigious. This logic can be tested systematically using the bars and radii instead of merely guessed.
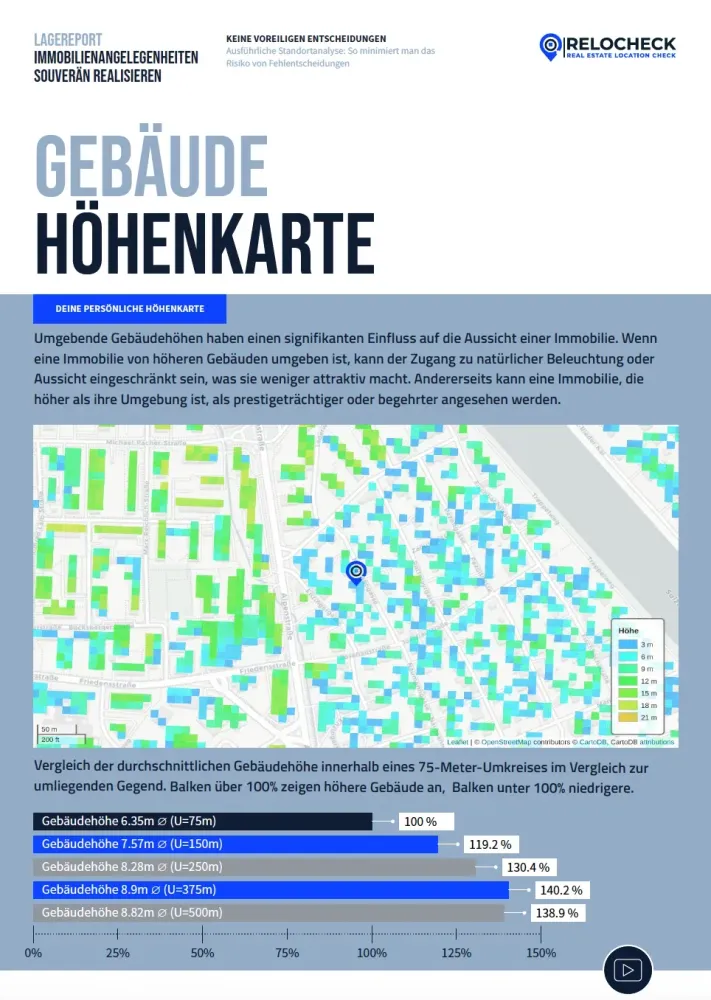
How to Read the Bars: Radii (75-500 m) as Development Impact Zones
The bars in the report are more than a statistic. They are a practical translation of the question: how far does the surrounding built form shape the place? Each radius represents a different impact zone. 75 meters, the micro-setting: this is the area that most strongly feels like the immediate neighborhood. Here, building height and spacing often determine whether facing windows can look directly inside, whether a balcony feels private, and whether interiors feel open or enclosed. A 75 m bar clearly above 100% is a clue that the development directly around the property is taller than average, often associated with denser street space or larger building volumes. 150 to 250 meters, the neighborhood edge: in these radii, you can see whether the taller development is only local, for example a single block or complex, or whether it continues across several streets. If the bars in these zones are also clearly above 100%, that points more to a connected cluster of taller buildings. If only the smallest radius is above 100% and the larger radii move back toward 100%, that can mean the property sits in a local concentration of density, while the broader surroundings quickly become more typical. 375 to 500 meters, the district pattern: these radii help classify whether the property lies in a generally high-rise district or whether it is more of a local exception. That is especially relevant when comparing options: if two properties are equally far from the center, but one sits in an area with broadly taller surroundings, bars in the larger radii above 100%, and the other sits in an overall lower-rise setting, then privacy, views, and perceived openness are often structurally different. The percentage logic is intentionally simple: above 100% means higher than the surroundings, below 100% means lower than the surroundings. For location decisions, this relative comparison is often more useful than an isolated number in meters because it shows how unusual the built form is compared with alternatives.
How to Derive Concrete Living and Value Questions from the Height Analysis
The real value appears when you do not just look at the height map, but translate it into clear evaluation questions. These questions are intentionally formulated for a broad target group. They work for renting, buying, and investing because they connect everyday use with long-term market logic. Views and sight lines: tall neighboring buildings can limit what you see. That does not mean a home is automatically bad, but it changes what counts as a view, for example a courtyard, an alley, a wall, a green interior block, or an open horizon. The taller the nearby buildings are, the more likely it is that views are shaped by surrounding construction. Privacy and visibility: this is often the most underestimated point. A location can be quiet and still feel unpleasantly exposed if facing windows at the same height are very close. On the other hand, dense development can also provide protection, for example when courtyards are screened. Here, the bars work as an early indicator: a clearly above-average close range, 75 m, should always trigger the question, what do the sight lines look like from living spaces and outdoor areas? Usability of outdoor spaces: for balconies and terraces, not only area matters, but quality of stay. Taller surrounding development often increases visibility from outside and changes wind and draft conditions in the street or courtyard. That is not automatically negative, but it is a location profile that has to match your priorities. Perceived tightness versus urbanity: some people consciously want urbanity, short distances, and city density, while others want openness and breathing room. The percentage bars give you an objective language for this: is the location above-average in building height, over 100%, or comparatively lower, below 100%? That helps sharpen search profiles without getting stuck in subjective wording. Marketing and demand, for buyers, investors, and professionals: the report logic is pragmatic here. If surrounding buildings are higher, attractiveness can suffer because of views or daylight; if the property is higher than its surroundings, it can appear more desirable. For investors, that means the height profile is a risk or opportunity indicator for demand, especially compared with alternatives in the same price segment. For agents, it helps manage expectations and address target groups more precisely. People looking for urbanity tolerate different development patterns than people who prioritize calm and privacy.
Typical Patterns You Can Identify Quickly from the Radii
The radius logic makes it possible to read urban form as a pattern, and these patterns are extremely helpful when comparing several properties. Pattern A: only the immediate area is tall, 75 m clearly above 100%, larger radii close to 100%. This can point to local densification: a single building complex, a perimeter block with a taller structure, or a corner with taller development. In practice, that means the property can feel very different from another one just two streets away. Pattern B: consistently tall, several radii above 100%. This is typical of neighborhoods with generally taller development. Here, the height profile is not an outlier, but part of the district character. For people searching for a home, that means if you prioritize open horizons, strong privacy, and a sense of spaciousness, you need to look within these neighborhoods for properties that compensate through building design or layout, for example a higher floor, a quieter rear side, or better distance from opposite buildings. Pattern C: immediate area normal, broader surroundings taller, 75 m around 100%, larger radii above 100%. This can mean the development immediately around the property is more moderate, but the district contains larger or taller structures nearby, for example along a main corridor or around a bigger complex. In practical terms, everyday living may be fine directly at the property, but the broader context is more urban and more compact. Pattern D: below-average height, several radii below 100%. This points to a setting that tends to be lower-rise. That can support openness, privacy, and potentially more attractive sight lines. At the same time, lower does not automatically mean better, but it is a clear location difference that can be compared objectively. These patterns are not meant to judge, but to translate: the report makes urban form visible as a location profile. That reduces bad decisions because you do not discover only after moving in that visibility from neighboring buildings or a feeling of enclosure is a lasting issue.
What Else You Should Consider: The Height Map as a Starting Point, Not a Substitute for Property Review
The height map is a very strong screening and comparison tool precisely because it is objective and consistent. Even so, it works best when you use it as a starting point for targeted property questions. First: interior quality still depends on the floor plan. Even in a denser surrounding built environment, an apartment can work extremely well if the main living rooms are well oriented or if the apartment is on a floor level that changes the sight lines. Conversely, even a lower-rise surrounding area can feel unpleasantly exposed if facing buildings are at exactly the same height and very close. Second: development is not just height, but also distance and structure. The percentage bars show the relative height position, but they do not replace looking at how streets are built, whether they are narrow or wide, whether courtyards exist, and how they are used. Third: for purchase decisions, the topic is also a risk lens. The report itself notes that despite high quality standards, large data volumes cannot guarantee complete accuracy and completeness in every case and recommends involving reputable professional support for important decisions. That matters because questions about surrounding development can in practice also touch planning-law issues, for example potential future changes in the area. The report provides a data-based foundation and helps trigger the right questions. If you use the height analysis as intended, as a standardized comparison basis, you gain one thing above all: you make the surrounding built form measurable and discussable. That helps compare multiple properties systematically instead of realizing only in everyday life that the surroundings feel very different from how they looked during the viewing.
- ✓ Read the radii (75-500 m): close range = privacy and sight lines, larger radii = neighborhood pattern.
- ✓ Apply the percentage logic: >100% means higher than the surroundings, <100% means lower than the surroundings.
- ✓ Where the close range is high, check specifically: visibility into the balcony and living spaces, plus the distance to facing buildings.
- ✓ Compare patterns: locally tall versus consistently tall determines whether you are seeing an outlier or district character.


